|
|
|
How to load data into an Excel spreadsheet
Plot with galactic coordinates
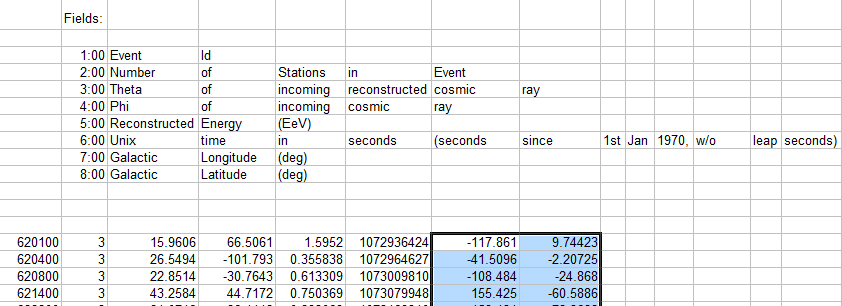
- Mark the cells which show the values for the galactic latitudes and longitudes with the left mouse cursor
- Activate the plot tool: go to "Insert" in the menu bar and choose "X Y Scatter plot"
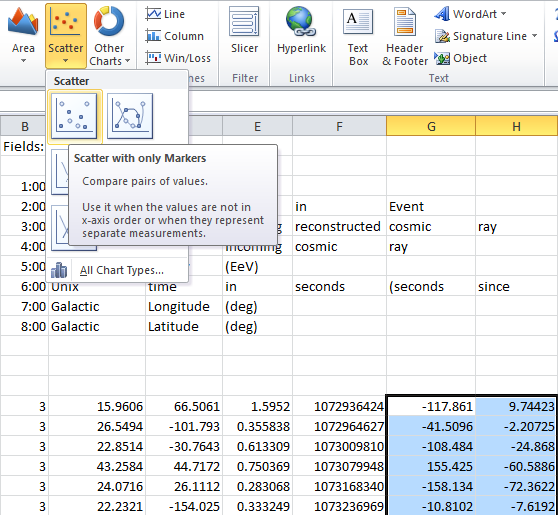
- A chart with your data will show up in your spreadsheet
- Click on the chart and select the corresponding chart layout in the menu bar
- You can modify "axis title" and "chart title" by clicking on the labels
- Double click on the axis to adjust the axis options if necessary
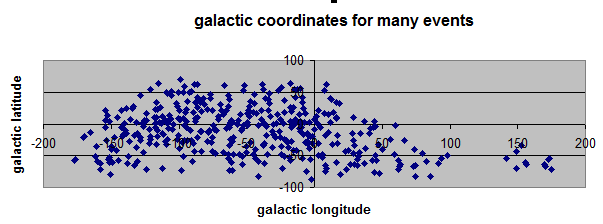
- Your final plot will look like this (only few events included):
|