 |
|
| Home | |
| Victor Hess | |
| Auger Project | |
| Coord.systems | |
| Terrestrial | |
| Galactic | |
| Celestial | |
| Space weather | |
| Unix Time | |
| Projects | |
| Ask me | |
| Contact | |
How can one plot average Auger scaler rates?
- Mark cell A1 and load (example showing how to load data) the downloaded data file into your Excel spreadsheet.
- Include a table for the conversion from unix time to date values.
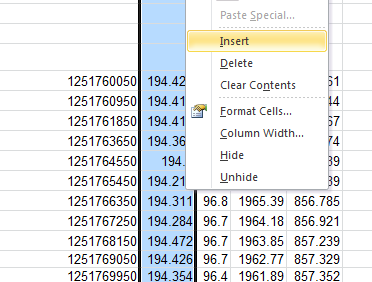
- Insert a new column labeled "Unix time in seconds to date values".
- The number of unix time seconds which elapsed since Midnight Coordinated Universal time are given.
The present screenshot shows cell A14 with the unix time in seconds and cell I17 with the value for seconds per day (86400 sec).
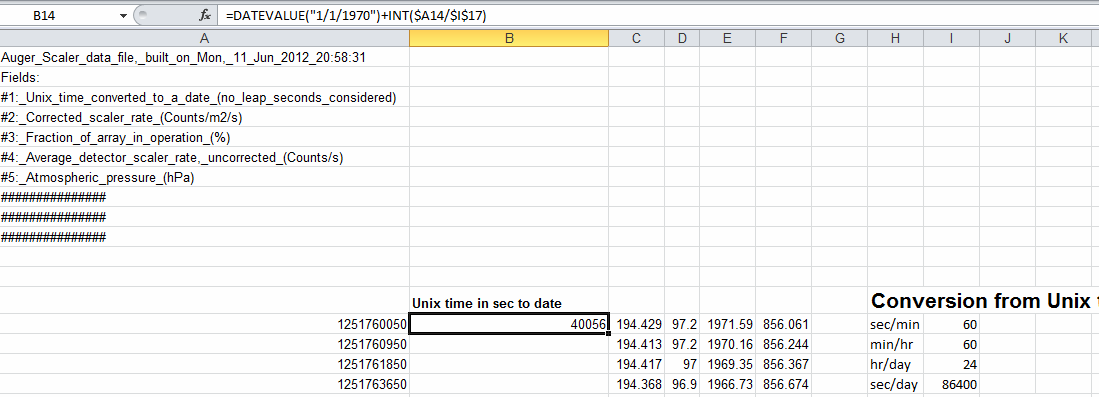
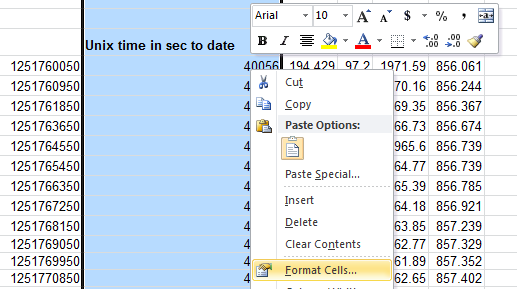
Write the following formula into cell B14 of the column "Unix time in seconds to date values": - Change the cell format in the column "Unix time in seconds to date values" to "date".
- Transfer the inserted formula and the cell format to all other cells of this column.
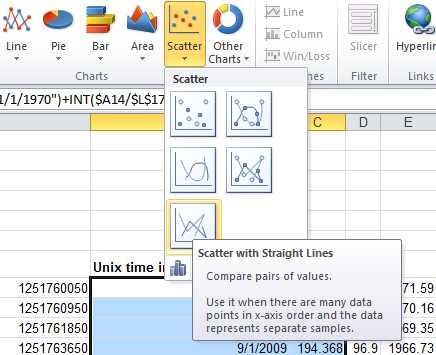
- Activate the plot tool: go to "Insert" in the menu bar and choose "scatter plot with straigth lines".
- Click on the chart and select the corresponding chart layout in the menu bar.
- You can modify "axis title" and "chart title" by clicking on the labels.
- Double click on the axis to adjust the axis options if necessary.
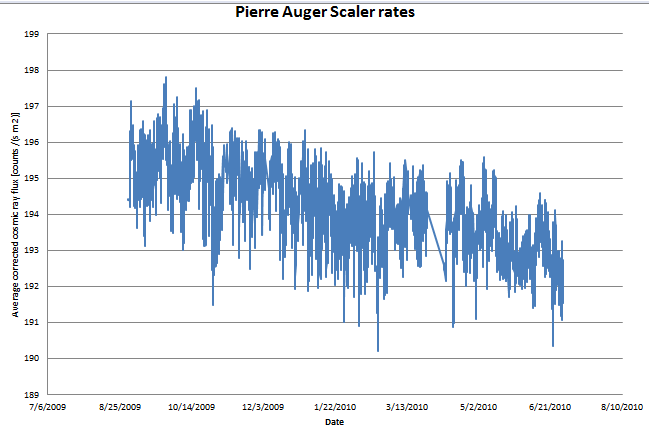
- This plot shows the impact of the earthquake on the average cosmic ray flux as a function of days.

=DATEVALUE("1/1/1970")+INT($A14/$I$17)
