 |
|
| Home | |
| Victor Hess | |
| Auger Project | |
| Coord.systems | |
| Terrestrial | |
| Galactic | |
| Celestial | |
| Space weather | |
| Unix Time | |
| Projects | |
| Ask me | |
| Contact | |
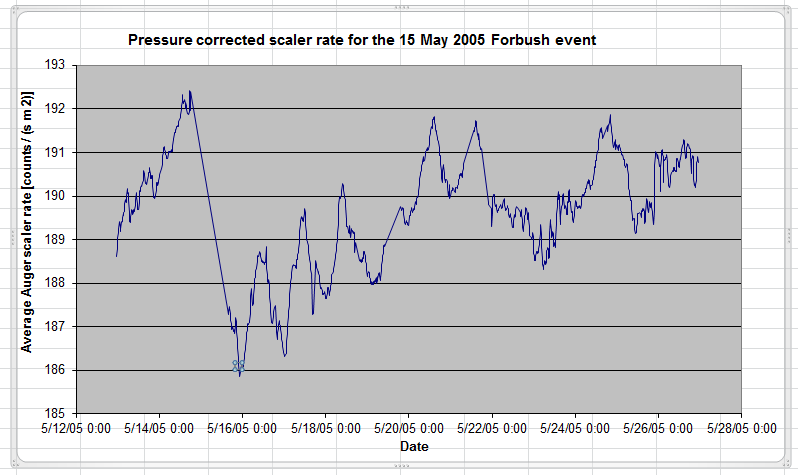
How to plot Forbush events
- Follow the instructions "How can one plot average Auger scaler rates?".
- Modify the following formula in cell B14 of the column "Unix time in seconds to date values":
- This is an example for a plot of the May 15 Forbush event
=DATEVALUE("1/1/1970")+INT($A14/$I$17)
by
=DATEVALUE("1/1/1970")+INT($A14/$I$17)+MOD(A14,$I$17)/$I$17
in order to get the day and time as well.